Getting Started With Data Visualization Using Python
 Cutie Eagle
Posted on 29 May 2025
Cutie Eagle
Posted on 29 May 2025
Python is a powerful programming language widely used in various applications. It features a comprehensive library for multiple applications. One of them is Matplotlib, which is a data visualization library. If you are new to Python or want to use open-source tools for your projects instead of commercial tools, let's get started. In this tutorial, we'll plot a sine wave in Python using matplotlib and numpy.
Installing Python
sudo apt install python3If you are using macOS and have installed Homebrew, you can use the command below to install it.
brew install python3Installing Library
For this tutorial, we need two libraries, matplotlib and numpy. We can install it using pip3. You don't need to install pip3, as Python installation includes pip3 by default. Run the following two commands to install both.
pip3 install matplotlib
pip3 install numpy
Writing Scripts
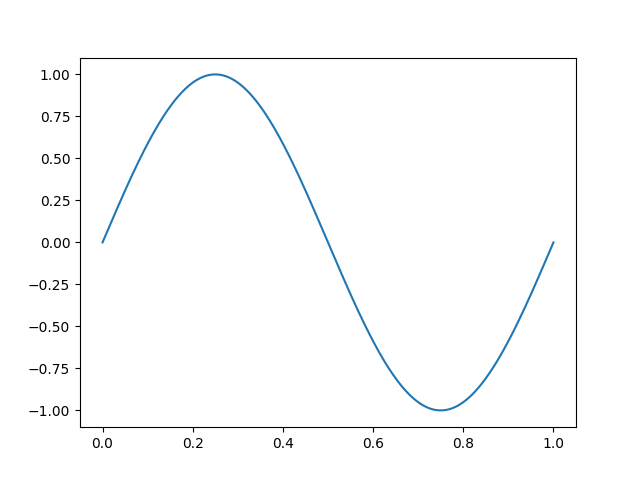
To write the Python script, you can use any text editor. I recommend installing Visual Studio Code text editor. However, you can use any tool you like to code. First, let's describe what we are going to plot. We'll plot a sine wave. The x-axis is time, and the y-axis is the amplitude. We can describe it with the equation.
x(t) = A sin (2 * PI * f)
where t is time, A is the amplitude, and f is the frequency. We'll create a time axis using numpy and calculate the y-axis based on the equation given above.
First, import the necessary libraries to plot the sine wave. Then, describe the constants and the equation, plot the equation, and save the file as sinewave.py.
import numpy as np
import matplotlib.pyplot as plt

f = 1
x = np.linspace(0,1,1000)
y = np.sin(2 * np.pi * f * x)
plt.plot(x,y)
plt.show()
Running Script
Open the terminal and change the working directory where the script is saved. Run the command.
python3 sinewave.pyYou should be able to see the sine wave plot. You can adjust the frequency and verify that you are receiving the plot correctly.
This tutorial serves as the starting point for using Matplotlib in your projects. You can review the Matplotlib documentation to see how to plot other types of plots as per your requirements.